In the wake of the recent election, we have already seen predictions about how the change in administration will affect various economic sectors, including the trucking industry. But whatever the various forecasts may say about the trucking sector’s future, there will remain two clear facts: 1) heavy-duty trucks and buses today adversely impact the health and well-being of communities around the country; and 2) the most surefire way to simultaneously reduce global warming emissions and the health impacts of the freight sector is through heavy-duty battery-powered electric trucks powered by an increasingly decarbonized grid.
Do you care about the lasting impacts of decisions made by your local school board about the school buses driving your kids to school? Or how rules driving electric trucks can reduce harm from future trucks? Or maybe you want to simply want to understand the health costs or global warming emissions of the local delivery truck you see every day?
If these types of questions are running through your head, UCS has the answers with a new tool comparing different types of trucks. Below, I walk through details of this new UCS analysis and what it says about cleaning up the freight sector. First, I walk through all the different considerations at play when considering the truck and fueling infrastructure. Next, I explain how we went about actually modeling the climate and health impacts of those truck options. Finally, I walk through how battery-electric trucks emerged clearly as the cleanest choice across the range of scenarios, and how you can use the tool.
There are a range of options for heavy-duty trucking
We’ve known for years that electric cars are always the cleanest option around the country when it comes to reducing global warming emissions from personal vehicles, but heavy-duty trucks and buses operate under much more diverse conditions, complicating things. For one thing, trucks and buses come in a range of different sizes, ranging from a heavy-duty pickup truck all the way up to a tractor-trailer. For another, they also are used in different ways, with some vehicles like school buses or delivery vans spending most of their time at low speed and stopping often, while a small portion of the largest vehicles may travel as much as 1,000 miles in a day, mainly at highway speeds.
This range of characteristics mean that the cleanest choice for one type of truck may not be the best for another, and that these choices can evolve over time. For example, the comparative advantage in energy efficiency of a compressed ignition engine used in a diesel truck as compared to a spark-ignition engine fueled with gasoline or natural gas is much greater at high loading (like in tractor trailers) compared to lower loads like delivery vans. But these trade-offs may change over time due to additional factors like fuel economy and emissions regulations.
To examine the cleanest heavy-duty truck and bus choices and how those may evolve over time, our analysis explored a a range of different vehicle characteristics:
- 8 different types of trucks of varying size and behavior: delivery van, delivery truck, garbage (refuse) truck, school bus, transit bus, drayage tractor-trailer, regional tractor-trailer, and long-haul tractor-trailer;
- 3 different powertrain types: battery-electric, combustion engine, and fuel cell;
- 6 different energy sources: gasoline, diesel, propane, natural gas, hydrogen, and electricity;
- 4 different model years (i.e. year the vehicle is purchased): 2023, 2027, 2030, 2035.
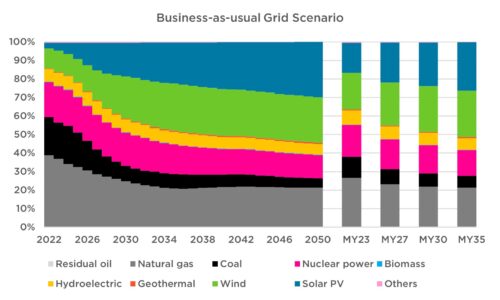
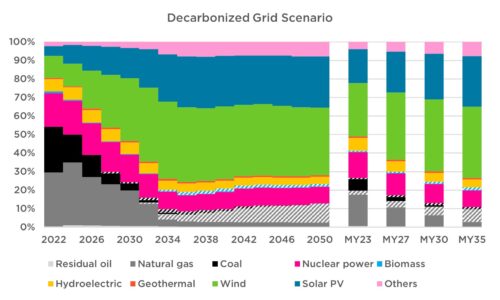
In addition to the vehicle characteristics, we also considered different energy futures. First, we considered both an electric grid consistent with today’s policies (“business as usual”), using data from the Energy Information Administration. We then also considered a grid that eliminates net global warming emissions by 2035 based on research from the National Renewable Energy Lab, using a conservative assessment of carbon capture technologies (“decarbonized grid”).


Two possible electric grid futures were considered in this analysis, a business-as-usual scenario based on the projected impacts of current policy, and a decarbonization scenario that targets zero net carbon emissions by 2035. This scenario relies, in part, on the deployment of carbon capture and sequestration (shown as hashed bars) to eliminate global warming emissions from the remaining fossil fuel fleet, but our analysis assumes that this will not reduce the health impacts of such power plants. The bars to the right of the graph represent the average grid used by model year 2023, 2027, 2030, and 2035 vehicles, respectively.
For the sourcing of hydrogen, we consider using either electrolyzers utilizing grid electricity or sourcing that hydrogen from natural gas via steam-methane reformation, which is where virtually all hydrogen comes from today.
Importantly, our analysis reflects improvements to all forms of trucks anticipated in the coming years, as new heavy-duty engine standards go into effect in 2027 and recent global warming emissions standards for vehicles continuing to push efficiency improvements across all types of trucks.
How to calculate the impact of a truck?
Once we identified the range of considerations for future new trucks, we can begin to think about the impacts of these vehicles. We considered two main impacts: total global warming emissions and total health impacts related to driving these trucks over their entire lifetime.
To estimate health impacts, we consider the impacts from the pollution generated from the use of the truck over its lifetime. These impacts include not just those from the pollution directly emitted from the tailpipe or particulate emissions from brakes and tires, but also upstream emissions related to the energy source powering the vehicle. In considering the upstream effects, we consider both the pollution generated in refining and distributing the energy (such as from a refinery or from the electric grid) as well as any extraction processes needed to obtain that fuel (i.e. pollution from oil recovery, coal mining, etc.). This pollution results in adverse health impacts ranging from lost days of school or work from aggravated asthma, to increased hospitalization for heart and lung diseases, to premature death.
We utilize EPA’s COBRA model, which uses air quality modeling and county-based population data to calculate the incidence of health problems for the trucks in question and a corresponding valuation of those impacts based on the related economic impacts. The COBRA model is exclusive to the contiguous United States, so no health impacts were calculated for Alaska and Hawaii. Additionally, the COBRA model considers two different rates of incidence for mortality related to particulate matter, or soot, leading to “low” and “high” estimates for our analysis.
It’s important to recognize that the impacts from heavy-duty trucks are location-dependent—the number of families living near fossil fuel power plants versus highways varies across the country, and we want to be sure that we are not simply shifting the health burden of our freight system from one community to another. There will also inherently be regional differences related to the power sources comprising the local power grid and how those evolve over time within a given policy environment.
Electrification is the best option in virtually every region no matter the truck or policy environment
Across every single scenario considered, battery electrification has the lowest global warming emissions…every year, every vehicle type, and in every region, even if the grid doesn’t improve beyond current policies (aka our baseline scenario).
While the story is a little more nuanced when it comes to public health considerations, battery-electric trucks still generally show the best way forward, even after 2027 when combustion trucks are expected to get cleaner under new EPA rules. In a world where no more progress is made on cleaning up the electric grid beyond today’s policies, battery-electric trucks still have the lowest impact on public health in 65-73 percent of the combination of trucks, regions, and model years considered in this analysis. And in the small number of cases where they are not the best performing option, they are not far behind, averaging only 19-22 percent worse impact. With a cleaner grid, the choice is even more apparent, with battery-electric trucks representing the best choice in 86-89 percent of all considered options, and falling behind by just 16-19 percent in the rare cases where it is not expected to be the best choice. It’s worth emphasizing here that the limiting factor here is how we’ve modeled the decarbonized grid—a grid powered exclusively by renewable energy, for instance, would be hands down the cleanest choice in 100 percent of cases. These data are simply meant to be illustrative to help frame the choices faced in attempts to clean up the freight sector.
No other choice comes close to battery-electric trucks at offering the same level of emissions and public health benefits. In the few cases where battery-electric trucks don’t have the lowest health impact, hydrogen fuel cell trucks were found to be the top choice, but such trucks will emit, on average, more than 3 times the global warming emissions over their lifetime than a battery-electric truck. This number increases to up to 13 times more, on average, when comparing a battery-electric truck fueled by a decarbonizing grid to a hydrogen fuel cell truck whose hydrogen is derived from natural gas, as is the case for virtually all hydrogen used today.
Don’t just take my word for it
Of course, me summarizing the analysis is not nearly as fun or educational as looking at things for yourself. And that is the entire reason we developed this tool—with so many choices and a trucking industry that would rather spend money on an astroturf site for misinformation to delay action than actually solve the harm caused by the freight sector, it can be difficult to sift through the noise.
Here are some examples of how this tool could be used:
- Are you a parent wanting to know what the lasting climate impacts are of their public school district locking in fossil fuel emissions from new propane school buses?
- Do you live near a freight hub and want to quantify how your truck counts translate into public health harms?
- Do you live in a state that is considering the Advanced Clean Truck rule and need to convince folks of the climate benefits at stake?
- Are you a fleet manager trying to argue for how cleaner trucks will improve your company’s carbon footprint?
Now more than ever we need advocates prepared with the best available data to advocate for the cleanest solutions for their communities. We need to be making decisions that address sustainability and public health now and in the long-term.
Download the full methodology for the UCS Clean Truck Map Comparative tool.
Have questions about the UCS Clean Truck Map Comparative Tool or want to share how you’ve used it to advocate for cleaner transportation choices? Let us know!

 5 days ago
20


